

In this article
A customer journey map is a picture of the route someone takes to get something done with you, from first noticing a need to choosing, using and recommending you. It sets out, stage by stage, what they do, what they are thinking and where they slow down.
Drawn well, it shows an organisation where it is losing people it has already half won. Drawn from the inside, it can look complete and still miss most of what decides the choice.
What is a customer journey map?
A typical map runs left to right through stages, with rows underneath. The stages are the steps of the journey. The rows record what happens at each one: what the person does, where they do it, what they are thinking and feeling, and where it goes wrong.
| Row on the map | What it records | Where the evidence comes from |
|---|---|---|
| Actions | What people do at each stage | Analytics, search data, enquiry records |
| Touchpoints | Where they meet you, or don't | Your channels, plus what people tell you |
| Thoughts and questions | What they need to know to move on | Interviews, sales and service teams |
| Feelings | Confidence, doubt, frustration | Interviews, watching people use what you have |
| Pain points | Where they hesitate or stop | All of the above, read together |
It works for a business, a charity or a council service alike. Only the ending changes: an enquiry, a donation, a booking.
What a good map shows
It shows the journey from the other side. Inside an organisation, people know the steps they own. Sales knows the first call, the website team knows the pages, service knows the complaints. Nobody sees the whole route the way the person on it does. A map puts it on one wall.
It shows where people hesitate, and so where to act first. A long list of improvements becomes a short list of moments that matter.
It gives a team one shared picture, which ends arguments that rest on each person's own corner.
What maps can miss
The usual map is made in a meeting room by people who work for the organisation. That is a sensible start and a poor finish. Kate Kaplan of Nielsen Norman Group calls the first draft from internal knowledge a hypothesis, one that "needs to be validated against external research". Here is what to look for when you test it.
What happens before people reach you
A map drawn from the inside usually starts at your website, because that is where your data starts. But much of the decision is made elsewhere.
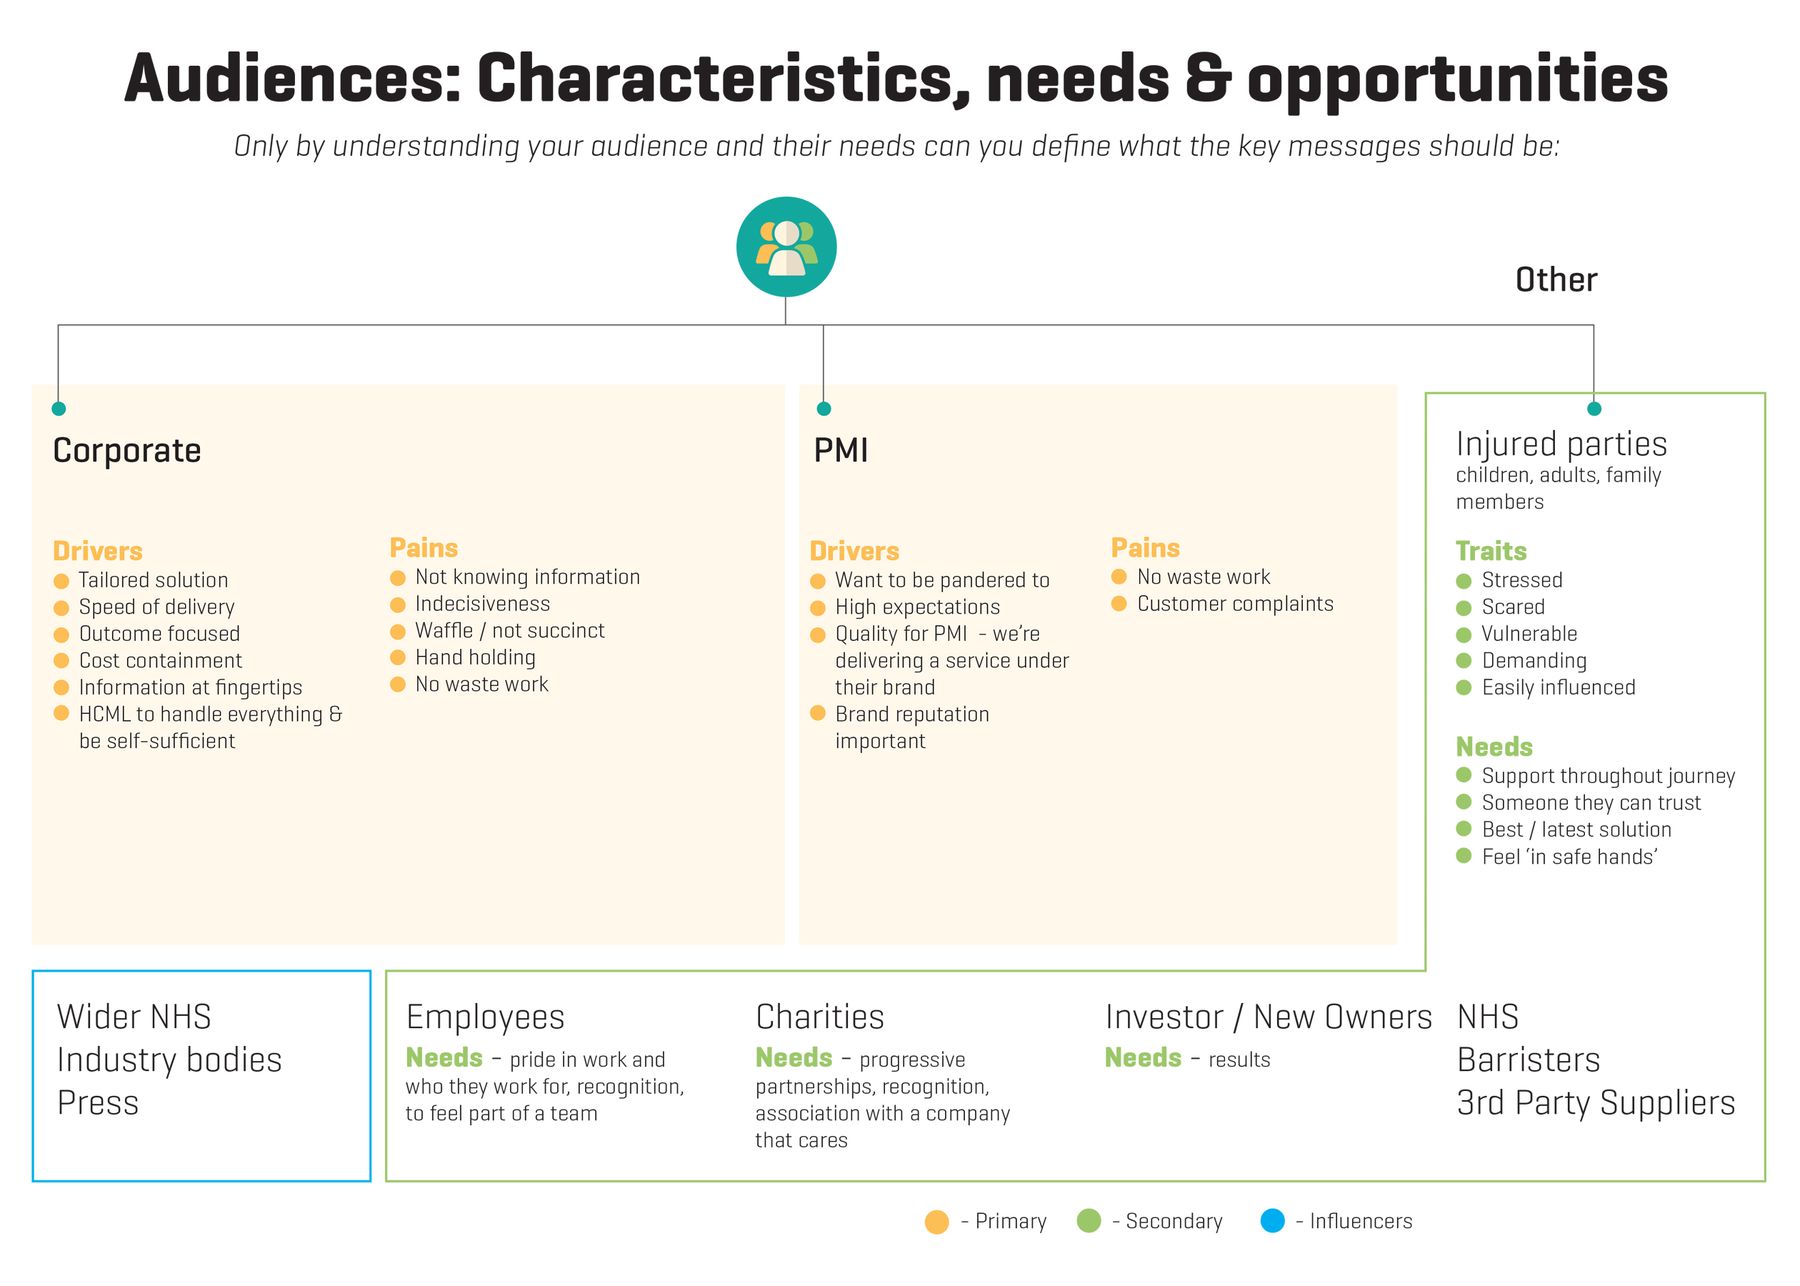
When we interviewed the intermediaries who recommend and buy HCML's corporate health services, they told us they hunt constantly for credible content to share onward, and turn overwhelmingly to LinkedIn to find it. They also wanted to hear from a provider all year round rather than be bombarded. It shaped a year of content built around how those people already worked.
The other people in the decision
Maps tend to follow one person, often called "the customer". Real choices usually involve others: someone who recommends, someone who signs off, someone who has to live with the result.
HCML's intermediaries recommend services to their own clients, and rely on suppliers to validate what they recommend. Their journey includes someone else's judgement of them. Marketing to a buying committee covers how to map who decides when an organisation buys.
That different people take different routes
One map for "our customers" averages several journeys into one that nobody takes.
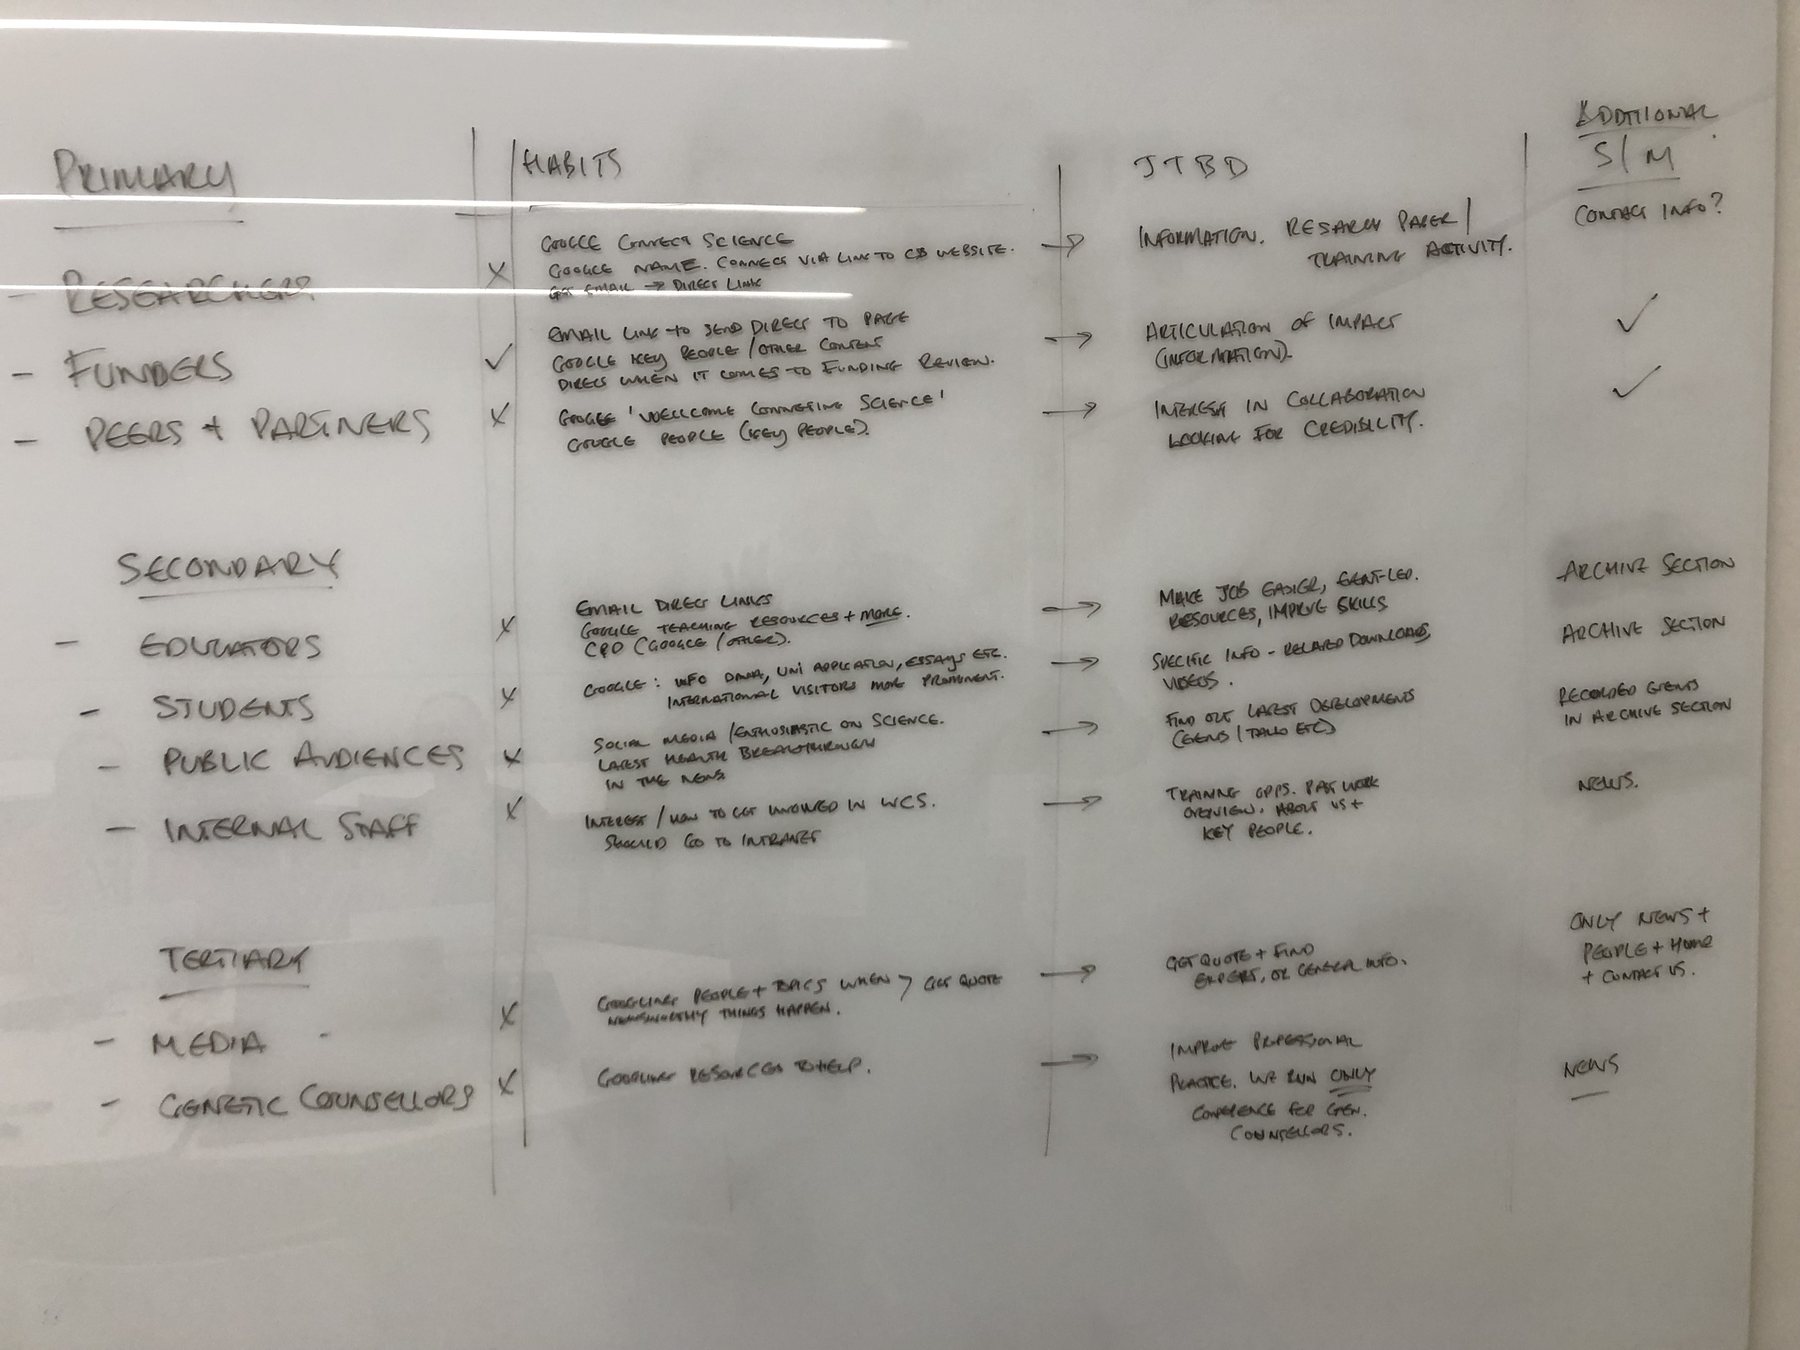
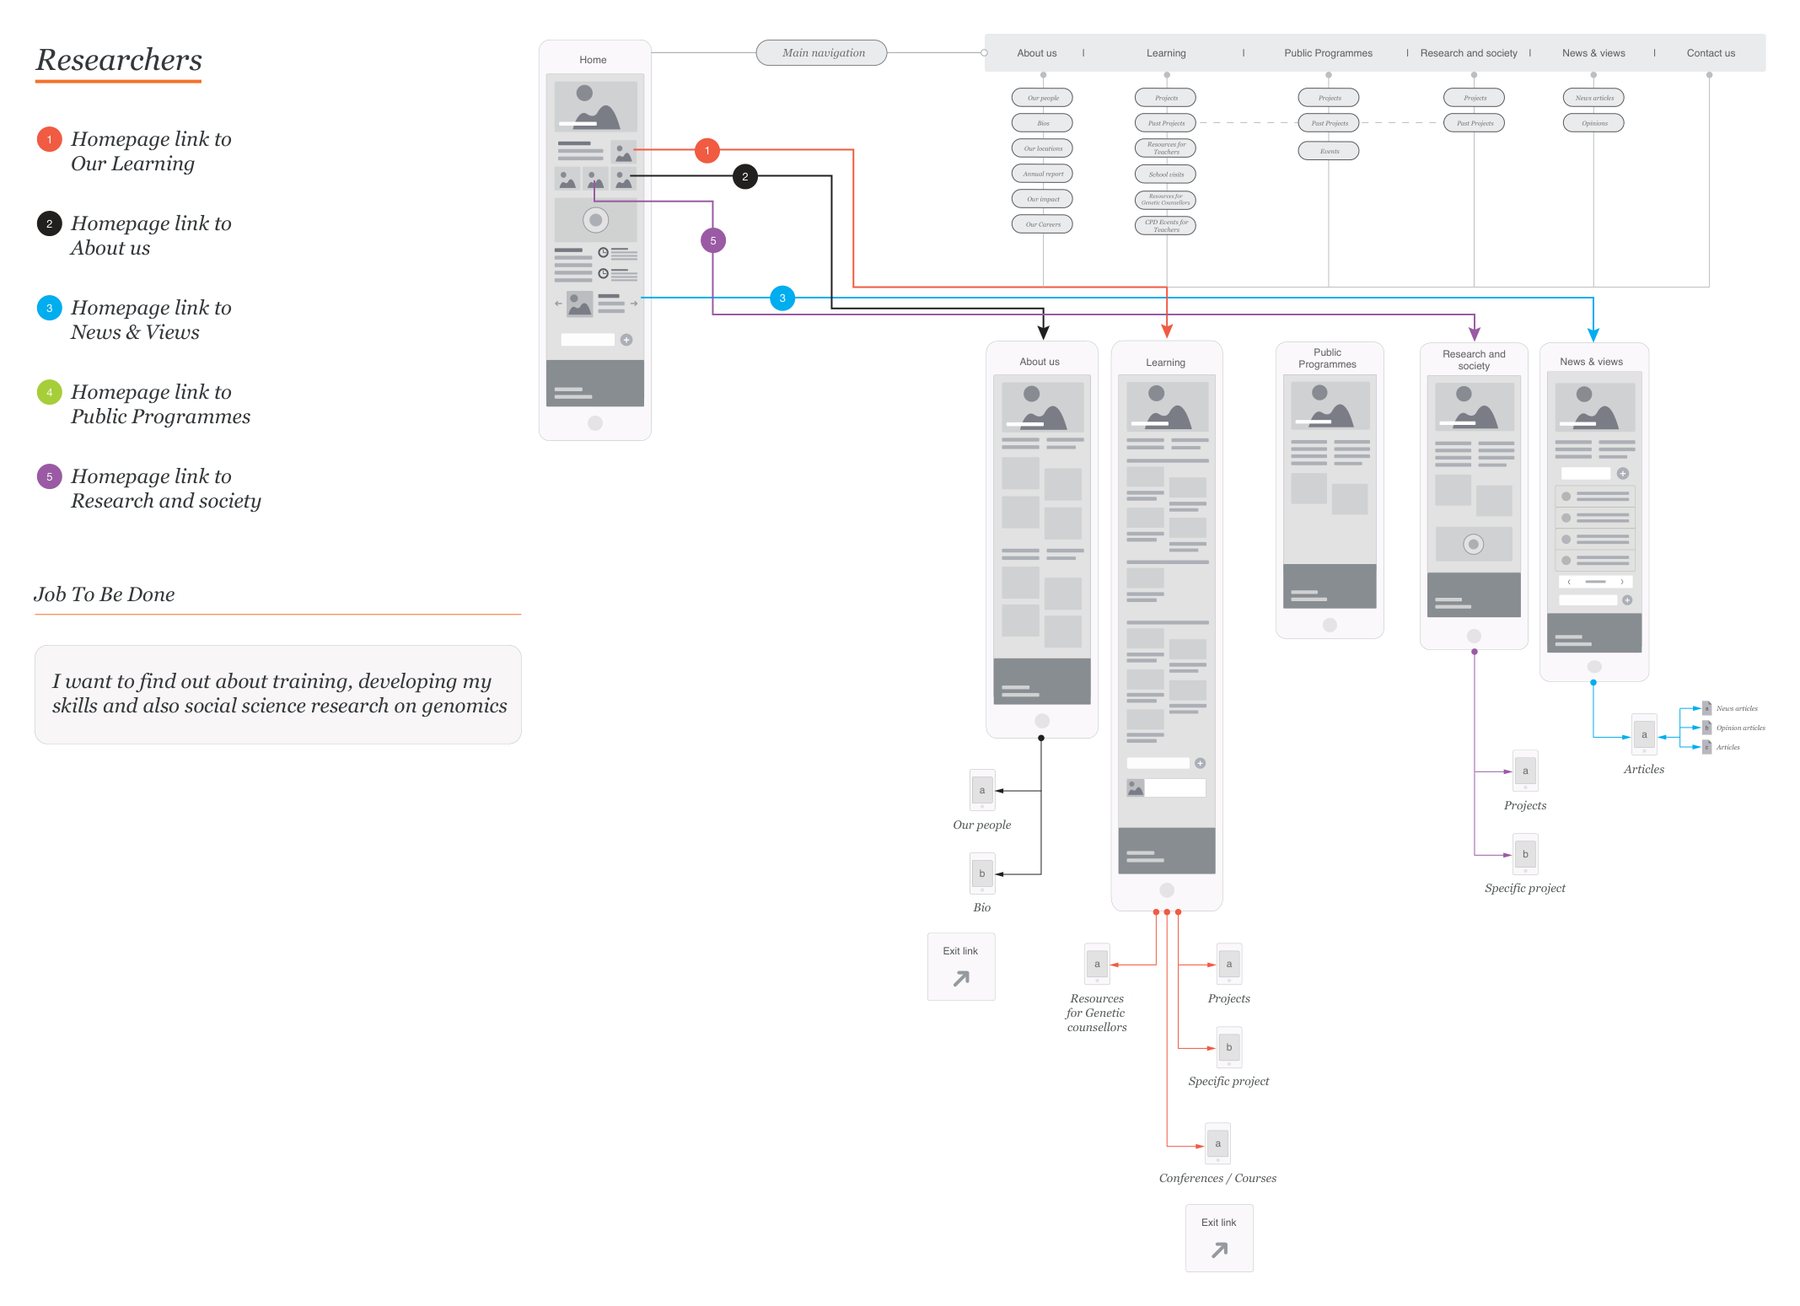
In workshops with Wellcome Connecting Science, we grouped the website's audiences into three and looked at each group's existing habits. Researchers wanted information for papers and training. Funders wanted the impact spelt out. Partners were looking for collaboration, and for credibility. We framed each group's task as a single job to be done, then drew a separate route for each, from the homepage to where they wanted to be, with as little effort as possible.
Why people do what they do
Analytics shows what people did on your website. It rarely shows why, or what they were worried about at the time. That comes from talking to them.
For Bush & Co, a case management and expert witness firm, we asked solicitors and insurers how and why they used Bush, what the pains and gains were, and what made them choose Bush over other firms. Two answers reshaped the journey: solicitors searched overwhelmingly by geography first, and they were cautious by nature, so trying someone new needed a push. There is more on asking questions that get honest answers in what good discovery actually looks like.
What happens next
A map is only useful if the findings inform a decision.
At Bush & Co, the findings changed the focus and functionality of the website: it gained a consultant finder on a visual map, built around the way solicitors search. That is the test of a journey map. Something gets built or said differently because of it.
How to map a customer journey
We use three sources, read side by side: what the organisation tells us, what the data shows and what the people on the journey tell us. The data shows where people slow down; the conversations explain it; the organisation knows which fixes it can make.
- 01Pick one audience and one job
Start with the group that matters most, and the thing they are trying to get done.
- 02Write down what you believe
Draft the journey with the people who sell and serve. Treat it as a hypothesis to test.
- 03Read the data
Search terms, analytics, enquiries, reviews and complaints show what people do and where they drop away.
- 04Talk to the people on the journey
Ask about a real, recent decision, including the steps before they found you and who else was involved.
- 05Redraw it
Stage by stage, in their words. Mark where they hesitate and what they needed at that moment.
- 06Choose what to change first
Two or three moments, not twenty. Agree who owns each.
- 07Test the change
Put a revised page, message or process in front of the same kind of people before rolling it out.
The last stretch of most journeys, from interested to in touch, deserves its own attention. Designing an enquiry journey people finish covers it.
How much effort it takes
More than a workshop, less than people fear. One audience and one journey might need a handful of interviews and an honest look at your data. Several audiences need a map each, which is more work, and usually where the value is.
What it cannot be is skipped and then guessed. A map built on assumptions gives a team confidence in the wrong things.
Where to start
Draw the journey your team believes in, on one page. Then ask three people who recently chose you, or nearly did, to walk you through how it actually happened. Where the two versions differ is where the work begins.
Journey mapping sits at the heart of human-centred design, and the thinking behind making the right step the easy one is behavioural design. If you would like help with the research and the map, our customer journey mapping service does both. Or get in touch.
Common questions
What are the stages of a customer journey?
Many guides use five: awareness, consideration, decision, retention and advocacy. They are a useful starting point, but the stages on your map should come from how your audience actually behaves. Some skip steps, some loop back, and some decide before they ever reach you.
What are the types of customer journey map?
Guides usually name four: a current state map of the journey as it is today, a future state map of how it should be, a day in the life map that takes in more than your part of it, and a service blueprint that adds what happens behind the scenes.
What should a customer journey map include?
The audience and the job they are trying to get done, the stages, and for each stage what people do, where they meet you, what they think and feel, and where they hesitate. Most useful of all, the two or three moments you will change first.